
Good morning, and thanks for your continued support of Extra Points.
First, a quick housekeeping note. We’re excited to announce that Robert Morris University has joined the Extra Points Library family:

Now, RMU will be able to browse contracts, athletic department budgets, historical records and more to help them make better decisions, all at an affordable price. If you’d like your athletic department, academic department, newsroom, office or other organization to get access to the same data, drop me a line at [email protected].
Earlier this month, I wrote about the operational budgets for every baseball and softball team that made the NCAA Tournament this year. On the high end, there were a few baseball programs, like Tennessee and Texas, that reported more than $10 million in operational budgets, with LSU and Arkansas not far behind. On the low end, teams like Murray State and East Tennessee State reported under $1 million.
On the softball side, Oklahoma towered over the pack, with a reported operational budget of nearly $7 million. The majority of P4 programs were in the $3-4 million range, with a handful of low majors, like North Florida, Jackson State and Eastern Illinois, reporting operational budgets under $1 million.
After I shared that story, many Extra Points readers wanted to know how the math shook out for other sports. So today, I’m happy to share the reported numbers for the men’s and women’s basketball teams that made the 2024-2025 NCAA tournaments.
A quick note on the methodology: This data comes from the Membership Financial Reporting System report, or FRS Report, a document that every NCAA institution in D-I and D-II must annually file. These reports include itemized revenue and expense breakdowns, by sport, across a variety of categories. As an example, here’s what a page from Auburn’s FY24 report looks like:
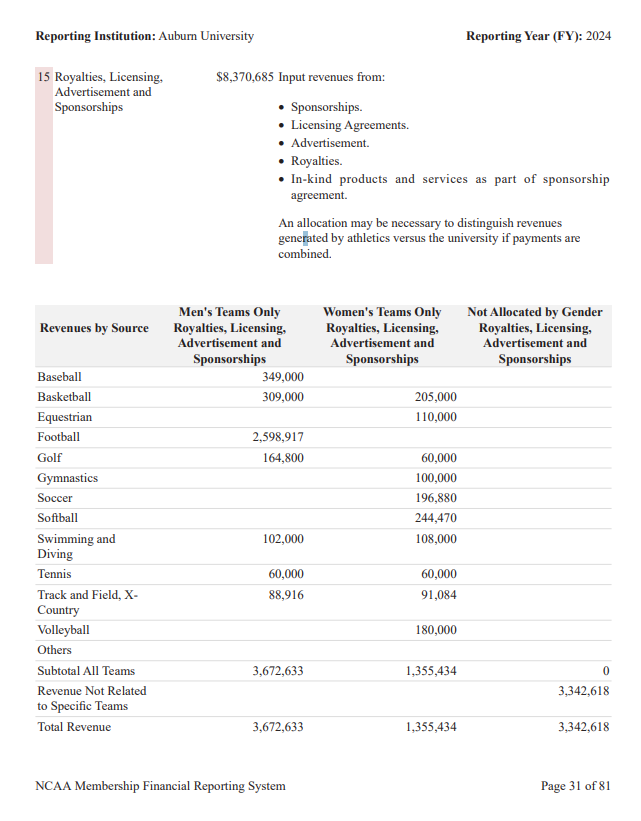
These are big reports! It takes time to get all the data from them.
I have access to this data because I file more than 200 dang Open Records Requests every January and pay the requisite fees to obtain each school’s FRS report for the Extra Points Library. That means I do not have data for private institutions. (No matter how nicely I ask, BYU and Duke are not compelled to share this information with me and are unmoved when I say cmonnnnn.) There are also a tiny number of public schools that I don’t have FRS reports for. Unluckily for me, three of those schools (Alabama State, Norfolk State and Troy), made the men’s tournament. If you have FRS Report data from these schools, and you email it to me at [email protected], I’ll give you free access to Extra Points Library.
Finally, these numbers are for operational budgets. They do not include athlete payrolls. The numbers schools have to report to the NCAA include spending on stuff like coaches, travel, recruiting budgets, game guarantees, coach buyouts, software, equipment and just about everything else that goes into keeping a program running. They do not include whatever money a shooting guard made via NIL.
That being said, here’s the data I was able to pull for men’s and women’s basketball.
First, FY24 Men’s Basketball Operating Budgets:
Kentucky | 30344949 |
Louisville | 22428151 |
UConn | 20400567 |
Kansas | 19736453 |
Tennessee | 19387341 |
Illinois | 18970439 |
Michigan State | 17586008 |
Arizona | 17252131 |
Missouri | 17208023 |
Michigan | 15815200 |
Auburn | 15761325 |
Texas | 15459259 |
Alabama | 15327459 |
Ole Miss | 15101109 |
Arkansas | 15024658 |
UCLA | 14435629 |
The rest of the chart, plus the women’s data, after the jump:
Want to read the rest of the newsletter? Subscribe today!
Premium Subscriptions make Extra Points possible. Upgrade today to get access to everything we write:
Upgrade to Premium for just nine bucks a month:


